Tree Canopy Viewer Hawaiʻi
The Division of Forestry and Wildlife and the U.S. Forest Service have partnered to create the first interactive, online canopy viewer pae ‘āina in Hawai‘i. The viewer is free to access and available in full here.
The canopy viewer aims to build upon our previous understanding of tree canopy in Hawai‘i. What does our tree canopy look like? Where is our tree canopy located? Is the distribution of tree canopy in Hawai‘i equitable? This tool could be used to answer these questions. The viewer could also be used to prioritize tree planting and maintenance where it can have the most impact for communities disproportionately burdened by risks that urban tree cover may help ameliorate.
For those unfamiliar with ArcGIS interactive maps and who want to learn how to use the application, please watch our tutorial here. If you have any questions about Tree Canopy Viewer Hawai‘i or require further assistance to use the application, please contact us at [email protected].
Tree Canopy Viewer Fellowship
Four researchers have been selected to carry out projects that utilize the Tree Canopy Viewer data as part of our first cohort of Tree Canopy Viewer Fellows. Fellows research will support urban and community forestry in Hawaiʻi by answering questions such as:
- How do urban trees impact the health of our communities and ʻāina?
- Which trees might be best for future climate scenarios?
- Where should tree plantings be prioritized?
What is Tree Canopy?
Imagine you are a Manu-o-Kū (White Fairy Tern) flying over your favorite monkeypod tree. As you look down from your bird’s eye view, you see the tree’s canopy – its leaves, branches, and stems that provide coverage over the ground.
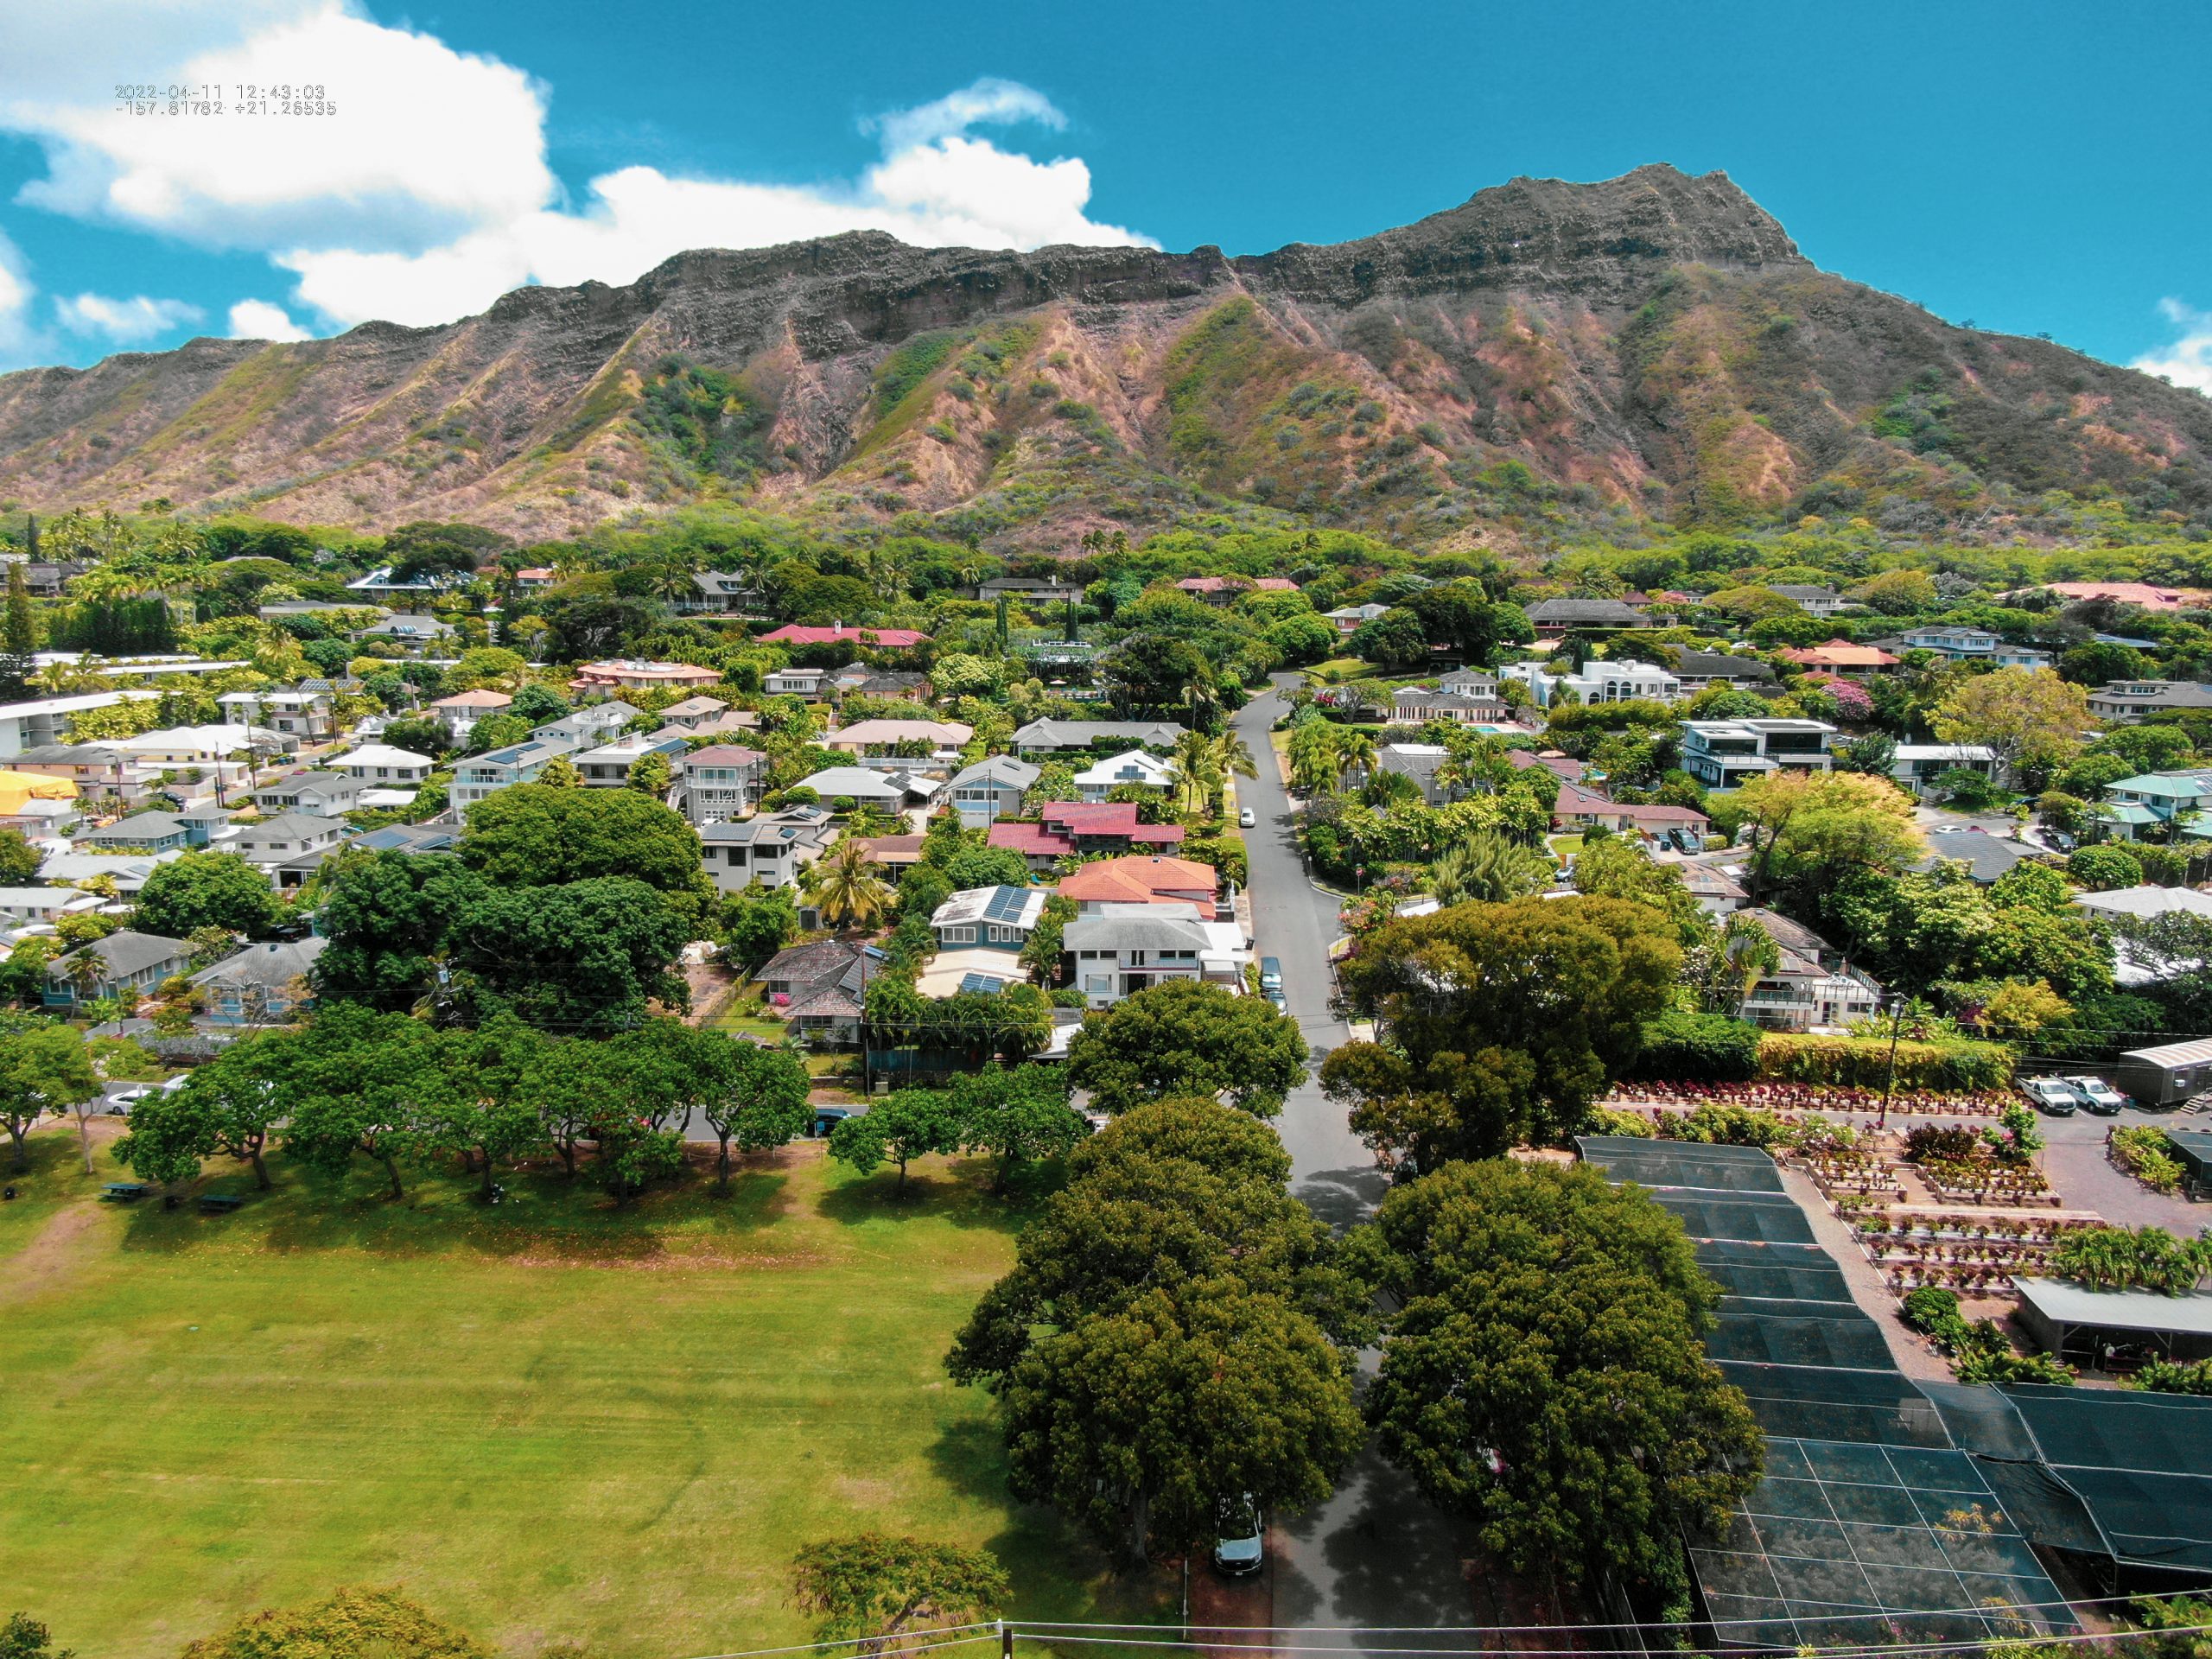
A tree and its canopy are a driving force behind numerous environmental, social, and economic benefits that we rely on every day. On average, the bigger the tree canopy, the bigger the benefits. Trees sequester carbon in their trunks, remove particulate matter from the air, clean stormwater run-off by removing harmful chemicals, cool ambient air by up to 10 degrees on hot days, shelter wildlife, and they create a sense of place. Research also shows that communities that plant trees together grow together; improving social ties and trust among neighbors and communities.
How is Tree Canopy measured?
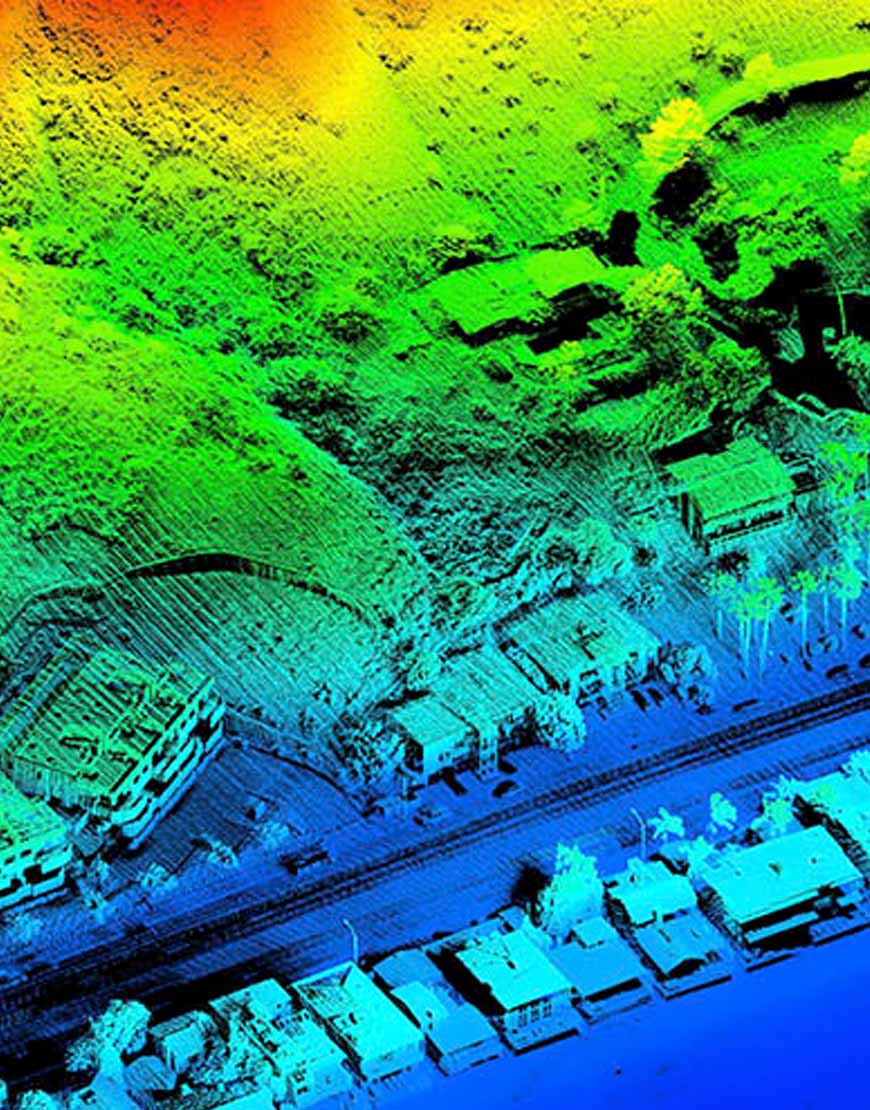 Advances in image resolution and the technology to analyze those images have improved over the last few years to allow us to see and clearly identify an individual tree’s canopy. For Hawaii’s tree canopy, artificial intelligence (i.e., a neural network classifier for tree cover) was trained using current and historic landcover data (e.g., MAXAR Vivid imagery and 1-meter resolution LiDAR 2016 or newer). Accuracy was checked against the latest imagery, inventories, and ground-truthing.
Our urban tree canopy was derived using the Canopy layer, 2010 Census Tract Boundaries, and the Carbon Assessment Land Cover dataset compiled by USGS. Urban developed areas were queried out of Land Cover dataset to embody residential areas, commercial areas, roads, freeways, etc. Canopy was clipped around 2010 census tracts as a boundary layer, and then clipped to examine urban areas.
What are the additional layers?
Tree Canopy Viewer Hawai‘i contains additional layers to compare with tree canopy coverage, including: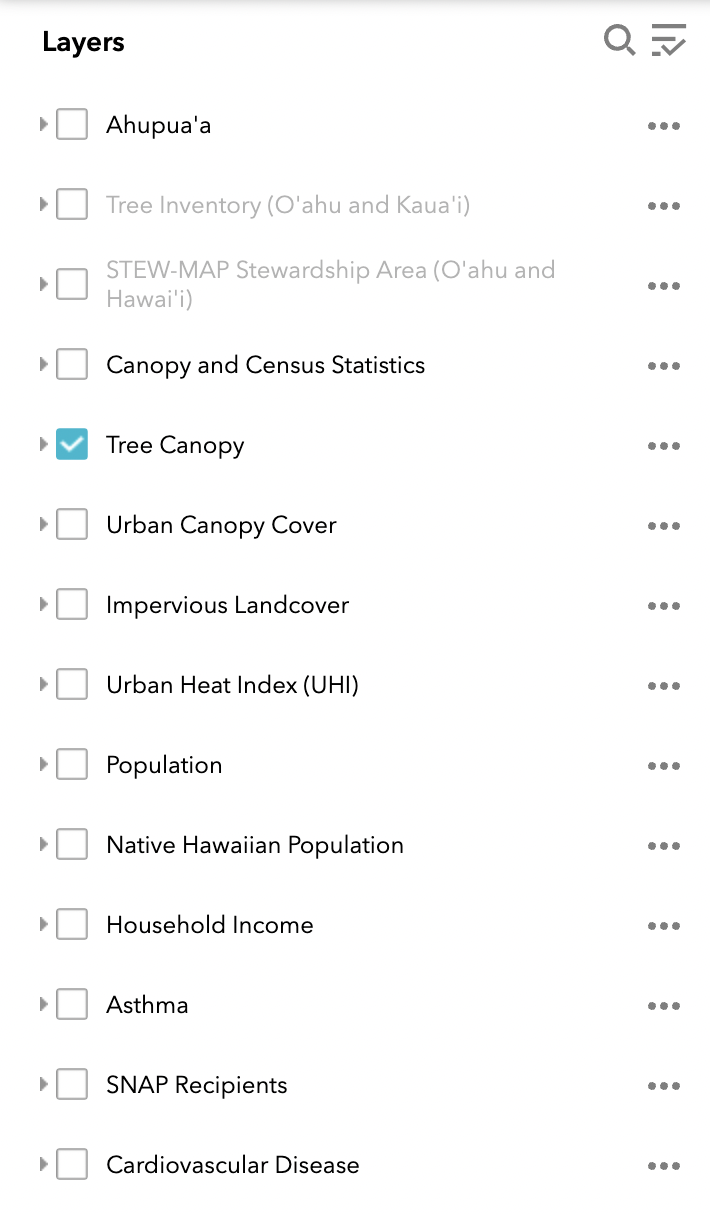
- Heat Severity
- Tree Inventory
- Impervious Landcover
- Population
- Native Hawaiian Population
- Stewardship Organizations
- Ahupua‘a
- Household Income
- SNAP Recipients
- Asthma
- Cardiovascular Disease
The viewer also contains the following layers:
- Priority 1: CEJST
- Priority 2: Native Hawaiian Population
- Priority 3: Low Urban Tree Canopy
- Priority 4: High Urban Heat Severity Index
- Priority 5: Low Income based on Title 1 Schools
You can see more detailed descriptions in the complete viewer layer list here. These layers provide information to help us understand differences in canopy across communities. They can also aid in the process of prioritizing urban greening goals (e.g., tree planting and tree maintenance) through a lens of equity with the goal that all communities will experience the benefits that tree canopy offers.
How can I use the Tree Canopy Data and Viewer?
Understanding the extent and location of a tree canopy can help a community design and implement sound management practices to maximize those services: prioritizing locations for tree planting, establishing urban forestry master plans and sustainability plans, and managing threats to canopy loss.
Depending on land cover imagery availability, there are several best practices for assessing your urban tree canopy. Check out this USDA Forest Service synthesis for more information- Urban Tree Canopy Assessment: A Community’s Path to Understanding and Managing the Urban Forest.
We recognize several other ways to use this data which is all available free to download. By downloading the data, you commit to citing and acknowledging your source for any products.
Suggested citation: EarthDefine LLC, US Forest Service, National Oceanic and Atmospheric Administration, HI Division of Forestry and Wildlife. 2021. Hawaii High Resolution 1m Tree Canopy Map [ESRI file geodatabase raster format], 2009-2020. https://www.fs.usda.gov/r05/state-tribal-forestry/hawaii-urban-canopy-data
Contact Forestry & Wildlife